What separates a one-time purchase from a loyal, returning customer can often be attributed to one thing: customer service. Though your competitorsm ...
What is a CRM Dashboard?
Written by: Victoria Yu
Victoria Yu is a Business Writer with expertise in Business Organization, Marketing, and Sales, holding a Bachelor’s Degree in Business Administration from the University of California, Irvine’s Paul Merage School of Business.
Edited by: Sallie Middlebrook
Sallie, holding a Ph.D. from Walden University, is an experienced writing coach and editor with a background in marketing. She has served roles in corporate communications and taught at institutions like the University of Florida.
Updated on February 4, 2024
What is a CRM Dashboard?
- What Are CRM Dashboards?
- Five W’s of CRM Dashboards
- Conclusion
Human brains aren’t meant to remember every little detail about every situation. We have a propensity to prefer summaries that capture the mood and general gist of a full body of work, whether they be newspaper headlines, movie posters, or introductory paragraphs in guides like these.
CRM dashboards are meant to be used in the same way; to give CRM users a way to understand and remember a full database of information from a glace. The dashboard provides succinct and useful summaries of the data stored within customer relationship management (CRM) systems. If you’re thinking of buying a CRM and want to understand how useful CRM dashboards can be, or are simply looking to step up your CRM dashboard game, then this guide is for you.
Key Takeaways
CRM dashboards are pages in a CRM that tabulate and display live, up-to-date performance metrics for the company’s operations.
CRM dashboards are used by managers of the same departments that use the CRM: namely, customer-facing functions such as marketing, sales, and customer service.
CRM dashboards are useful because they allow managers and decision-makers to agilely adjust their strategies as the situation calls for it, maximizing opportunities and minimizing losses.
What Are CRM Dashboards?
To start off, CRM stands for customer relationship management, and usually refers to software systems that track and store customer data and interactions during and after the sales process. By recording and analyzing this data, companies hope to provide more personalized service to their customers, driving sales and customer loyalty.
Now, with all of the customers and operations companies deal with on a daily basis, these software systems contain quite a lot of information that changes with every moment. Though a sales rep might be happy enough simply looking at the data for their own leads, sales managers have their work cut out for them trying to stay up-to-date on which leads are at which stage of the sales funnel, how each rep has been performing, how much revenue the team will bring in this sales period, and a whole score of other metrics that are crucial to understanding the sales department’s health.
That’s why CRM platforms often include CRM dashboards, which are image hubs displaying key performance indicators (KPIs) and graphs, condensing a CRM system’s most crucial data into one place. With a quick look at the CRM dashboard, any member of the company can quickly gain a sense of how the company is performing at the moment.
Five W’s of CRM Dashboards
It’s well and good to simply say that CRM dashboards are live hubs of KPIs, but what does that actually mean? How are CRM dashboards actually used in companies, and why are they useful? To gain a deeper sense of how CRM dashboards are used by companies, let’s answer the five W’s: who, what, when, where, and why.
1. Who Uses CRM Dashboards?
Anyone with access to the CRM can view the CRM dashboard, but it’s most commonly used by managers to monitor their team’s day-to-day performance.
CRM systems are used by every customer-facing role in the organization (marketing, sales, and customer service) as a central location to store and manage customer interactions and data. As such, the data synthesized into the CRM dashboard is used by managers of those teams to measure their employees’ performance and analyze customer information.
2. What Do CRM Dashboards Display?
CRM dashboards display live data on the company’s sales activities, performance, and progress toward goals. Some examples of KPIs it could display are:
- Revenue made this sales period
- Sales and revenue forecasts
- Percentage of quota met
- Average time to close
- Average sales values
- New leads
- Lead sources
- How many leads are in each stage of the sales funnel
- Conversion rates for each funnel stage
- Progress to completing projects and goals
- Individual rep performance (number of calls, emails, deals, etc)
That being said, most CRM systems allow users to customize their dashboard and interface, only displaying metrics that are valuable to the individual company.
Here’s an example of what a CRM dashboard could look like, courtesy of CRM vendor HubSpot.

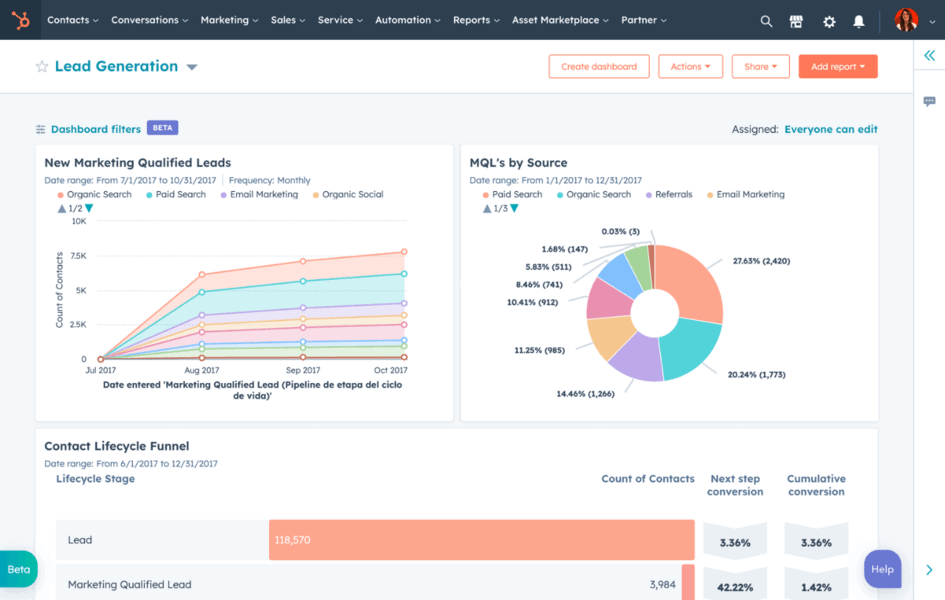
Underneath the top banner, we see that this is specifically a Lead Generation dashboard used by the marketing department. As such, the KPIs measured focus on how many marketing qualified leads the company has discovered, where they discovered them, and how many of them are moving down to the next step of the sales process. With this information, a marketing manager could hone the team’s efforts on the marketing channels that provide the most qualified leads.
3. When Would You Use a CRM Dashboard Over Reporting?
Why use a CRM dashboard when you can simply generate a sales report? While both of these are great tools for measuring a business’s activity, they differ quite a lot in scale.
CRM reports usually provide in-depth reviews and analyses of a department’s performance for a set period of time, as well as strategic recommendations based on the data. CRM reports can take a lot of time and effort to compile, so they’re usually only created at the end of each sales period, such as each month or financial quarter. These summaries and recommendations are then presented to the executives to guide company strategy.
On the other hand, CRM dashboards provide quick touch-and-go overviews of the department’s live activities and performance. Rather than laboriously gathering and analyzing data points from all of a CRM’s database, the dashboard provides an image-heavy view of the company’s performance so that managers can understand activity status from a quick glance, enabling them to fine-tune daily activities.
In other words, a CRM dashboard is a lightweight version of the CRM report. While both are valuable to companies, CRM dashboards provide more accurate, up-to-date information at the expense of high-level strategic analysis and recommendations.
4. Where in the Company Are CRM Dashboards Used?
As we mentioned earlier, CRM platforms are used by all customer-facing departments in the organization: namely marketing, sales, and customer service. On top of that, CRM dashboards could be used by executives and managers.
Rather than having one CRM dashboard filled with KPIs for all three of these disparate groups, a great thing about CRM platforms is that they often support multiple customizable dashboards. This means you can have one for each department in the company or even one for each team in each department.
First, marketing teams leverage CRM dashboards to evaluate the effectiveness of marketing campaigns, track lead generation and conversion, analyze customer segmentation and engagement, and make data-driven decisions to optimize marketing efforts. Then, sales teams use CRM dashboards to track their pipeline, monitor lead conversion rates, analyze sales forecasting, measure individual and team performance, and identify areas that require improvement. Finally, Customer service teams utilize CRM dashboards to manage and track customer inquiries, monitor response times, identify recurring customer issues, measure customer satisfaction, and ensure efficient resolution of customer problems.
Above all that, executives and managers at a company could use CRM dashboards to gain a holistic view of the company’s sales, marketing, and customer service performance. They can oversee team performance, monitor revenue generated, identify trends, and make strategic decisions based on the data presented. CRM dashboards streamline data analysis, enhance collaboration, and facilitate efficient decision-making, ultimately leading to improved customer relationships and business growth.
5. Why Should Companies Use CRM Dashboards?
Companies should leverage CRM dashboards to their fullest extent because they give managers a live view of current KPIs, which lets them make data-based decisions on the fly. By immediately capitalizing on the freshest opportunities and being quick to cut imminent losses, the company can maximize its operational efficiency and raise its bottom line.
Conclusion
CRM dashboards keep everyone in the company on the same page, showing the most accurate information for everyone to determine how close the team is to achieving its goals. It cuts down on time spent reporting to managers or cobbling together reports, giving employees more time to get work done.
If you’re not using your CRM dashboard to its fullest potential, you could be missing out on hours of time saved and countless sales made. Once you customize your CRM dashboard to your specific team’s needs, it can become an invaluable tool that will guide your managers and employees to everyday strategic success.
FAQs
What are some best practices for making my CRM dashboard?
Though we gave quite a few suggestions for KPIs that are typically in CRM dashboards, your own dashboard should only contain KPIs that you personally use to track your team’s performance: nothing more, nothing less.
So for each business function, this might look like:
- Marketing: number of marketing qualified leads, number of leads by source, conversion rates to the next funnel stages
- Sales: progress to quota fulfillment, average sales cycle length, average deal size, number of leads in each funnel stage, sales rep activity rates
- Customer service: total number of support cases, average time per case, number of cases by source, number of cases per agent
- Management: overall performance for each marketing, sales, and customer service team, number of leads, overall revenue, sales volume, average deal size, total number of support cases
But of course, these should be customized to your own team’s specific activities. Whatever metrics you were tracking prior to using a CRM dashboard, you should track using the dashboard itself.
Who are some vendors of CRM software?
Some vendors of CRM software are HubSpot CRM, Salesforce CRM, and Zoho CRM.
If you haven’t purchased a CRM for your business yet, we’d like to advise you not to think too drastically about CRM dashboards when shopping around. Virtually all CRMs include customizable dashboard functionality on their platforms, so it would be a moot point to base your CRM purchase on how the dashboard looks. It’d be like purchasing a phone based on how the home screen looks on the display! Instead, we’d recommend you base your purchase on features and functionality.
What will the future of CRM dashboards look like?
As we mentioned before, a large difference between CRM dashboards and CRM reports is that reports often require managers to take one step further and derive strategic insights and recommendations from the data presented by a dashboard.
With generative AI and machine learning on the rise, it may be possible in the near future for CRM dashboards to automatically generate those insights and recommendations by themselves, adding more functionality and power to CRM dashboards. Some industry leaders have already begun exploring integrating AI into their CRMs, such as Salesforce’s Einstein GPT.
Featured Resources

How to Use CRM for Customer Service
Published on April 10, 2024
Read Now

What is Collaborative CRM?
Published on April 10, 2024
Are you looking to run your business more collaboratively? Would you like your internal departments and teams to be more connected, informed, andres ...
Read Now

How to Build a CRM System
Published on March 18, 2024
If you’ve ever worn a custom-tailored suit, you understand how having something custom-made can be both a blessing and acurse. On theone ...
Read Now