As the name implies, a sales report tracks sales metrics over a specific period of time to examine the performance of the sales team. A sales report is essentially a collection of smaller, interconnected reports – presenting them together allows for greater understanding and insight.
How to Create a Sales Report
Written by: Victoria Yu
Victoria Yu is a Business Writer with expertise in Business Organization, Marketing, and Sales, holding a Bachelor’s Degree in Business Administration from the University of California, Irvine’s Paul Merage School of Business.
Edited by: Sallie Middlebrook
Sallie, holding a Ph.D. from Walden University, is an experienced writing coach and editor with a background in marketing. She has served roles in corporate communications and taught at institutions like the University of Florida.
Updated on March 3, 2025

So you’ve got your sales process set and the revenues are rolling in. Great! Now how do you analyze your success to generate a useful sales report?
If you’re new to sales and sales reports, producing your first one might be a major mystery. But don’t worry – you’ve come to the right place. This guide details what to include in a sales report to ensure it provides real insights that drive business growth.
What’s a Sales Report?
The sales process is an overview of the actions a sales rep takes to close a sale. It has multiple stages, from lead generation to post-sale follow-up. Common data points include total sales revenue, sales by product or service, and sales forecasts.
Your sales and marketing teams will review your sales reports, as will top managers and executives, so proper preparation is crucial.
Why is Creating a Sales Report Important?
Why are sales reports so important that you need one every month? Sales are your company’s lifeblood, driving revenue and business growth. If sales aren’t flowing, your business needs to be aware of it as soon as possible.
Sales reports are meant to provide a comprehensive overview of your sales totals and your expected sales in the near future. Over time, they will show you whether sales are thriving or flagging, revealing the effectiveness of your sales management. Insights gleaned from a sales report can be used to improve sales strategy and set better targets.
They can also improve communication with other departments, keeping everyone on the same page about sales projections, expected revenue, and more.
What Type of Sales Report Should I Create?
Now that you know how essential sales reports are, it’s time to create one. But before you dive in, it’s best to consider what you hope to accomplish.
There are many types of sales reports and even more ways to present your data, so it’s important to take stock of your audience, your goals, and all your options before you begin.
Types of Sales Reports
Determining which type of sales report fits your needs can be a challenge. Your choice should hinge on several factors, including the products or services you offer, your goals, and key metrics.
If you’re looking to track team performance, for instance, a sales performance report is likely the best option. But if you’re interested in understanding customers’ buying habits, a customer sales report may be more suitable.
It’s essential to understand the different types of sales reports and how each can help your business. The right report should provide invaluable insights into your sales processes, identify areas for improvement, and guide decisions that drive business growth.
Use the wrong report and you could be left floundering, trying to figure out your next move.
Here are some common types of sales reports:
- Opportunity Score Report – The opportunity score report is the most basic report type. It shows a list of sales opportunities with an opportunity score indicating the likelihood of success for each, and includes metrics such as the total number of opportunities, the total value of opportunities, and the probability of closing by score. It’s used to help focus efforts on the most promising opportunities and allocate resources more effectively.
- Summary Report – A sales summary report provides an overview of sales performance over a specific period. It includes metrics such as total revenue, expenses, number of units sold, and average order value. It’s often used to give partners a quick snapshot of overall sales performance.
- Detailed Report – A detailed sales report provides more granular info about sales performance, including data on individual products, customers, and sales channels. This report is useful for identifying trends and making more informed business decisions.
- Customer Report – A customer sales report provides information about the sales activities and performance of individual customers or groups of customers. It includes customer data such as name or ID, sales revenue generated from the customer, and the number of orders placed. It’s used to evaluate the effectiveness of sales and marketing efforts, identify priority customers, develop targeted marketing campaigns, and shape personalized customer service. A customer sales report can also identify opportunities for cross-selling, upselling, and improving customer satisfaction and retention.
- Upselling Report – An upselling report provides information on the effectiveness of upselling efforts. It includes metrics such as upsell success rate, average order value, and customer satisfaction. It’s used to help refine upsell offers and target the right customers.
- Comparative Report – A comparative sales report compares sales performance across different time periods, product lines, or geographic regions. This type of report can identify areas of strength and weakness, and inform future business strategies.
- Forecast Report – A sales forecast report predicts future sales performance based on historical data and market trends. It’s used to help set sales goals and develop sales strategies.
- Performance Report – A sales performance report evaluates the effectiveness of individual salespeople or teams. It includes metrics such as number of sales, revenue generated, conversion rates, average order value, and customer retention rates. It’s used to identify top performers and areas for improvement, and to inform training and coaching strategies.
- Activity Report – An activity sales report tracks the daily activities of salespeople, including the number of calls, emails, and meetings. It’s used to monitor productivity and identify areas where salespeople may need additional training or support.
- Territory Report – A sales territory report breaks down sales activity by geographical region or market segment. It’s used to identify trends, opportunities, and performance of sales territories.
- Pipeline Report – A sales pipeline report tracks the progress of sales opportunities through the sales pipeline. It includes metrics such as the number of leads, win rate, and the average time it takes to close a deal. It’s used to identify bottlenecks in the sales process and forecast future revenue.
Choosing the right type of sales report is essential for businesses looking to understand and optimize their sales performance. Let the needs of your business, the depth of analysis required, the frequency with which you need to report, and your intended audience guide your choice for which type of report to create.
Sales Report Formats
Once you’ve chosen the best report for your company, the next step is to decide on a format.
Factors to Consider
When choosing a sales report format, there are several factors to consider to ensure it meets the needs of your business and provides the most relevant information.
- Purpose – What do you hope to accomplish with the sales report? Are you presenting it to external partners or using it for internal analysis? Depending on the purpose, one format may be more appropriate than another.
- Audience – Who will read the report? Are they familiar with the data and metrics or will they need explanations? Depending on the audience, a more visual (dashboard or presentation) or narrative format may be appropriate.
- Data Complexity – If the data is relatively straightforward, a spreadsheet or dashboard format may be appropriate. If the data is more complex and requires explanation, a narrative format might work best.
- Timeframe – If you’re presenting data that covers an extended timeframe, a dashboard or spreadsheet format may be more appropriate. If your data covers a limited period, a PDF or presentation format may be more fitting.
- Customizability – Consider whether you need to be able to customize the format. Do you want to be able to add or remove data points as needed, or change the visual display to better illustrate patterns?
It’s important to choose a format that’s easy to understand, visually appealing, and provides the most relevant information for your business needs.
Choosing a Format
The most popular formats for sales reports are spreadsheets, which present easy-to-read data in an organized manner, and presentations, which create compelling visuals that emphasize key insights. Here’s more detail on the most common formats:
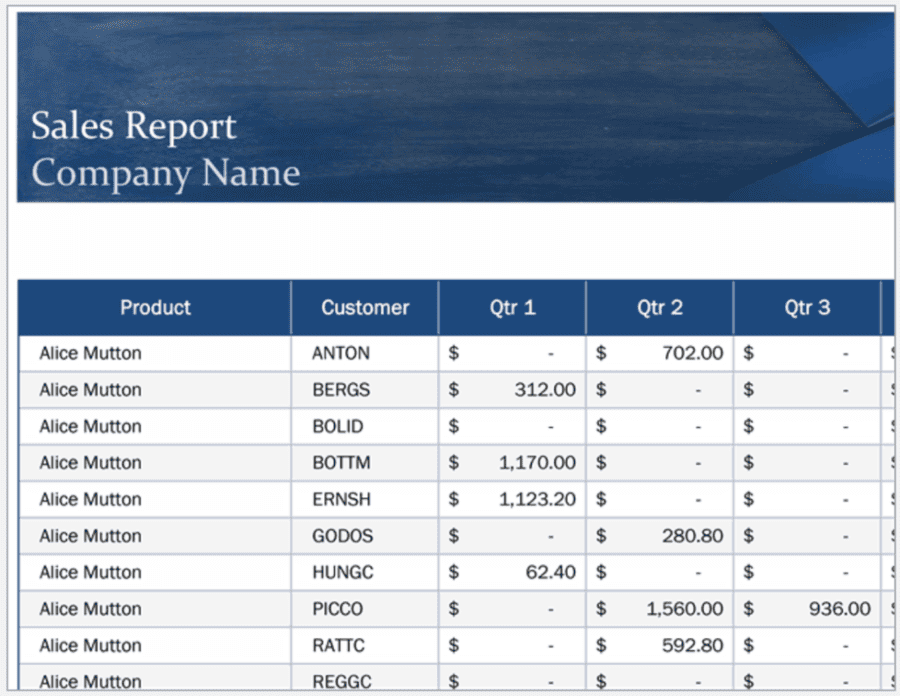
- Spreadsheet Format – The spreadsheet is a popular format that allows you to easily organize, present, and analyze data. This format, also known as a tabular or pivot table format, can be created using Microsoft Excel, Google Sheets, and other spreadsheet applications.
Here’s an example of a sales report in spreadsheet format.
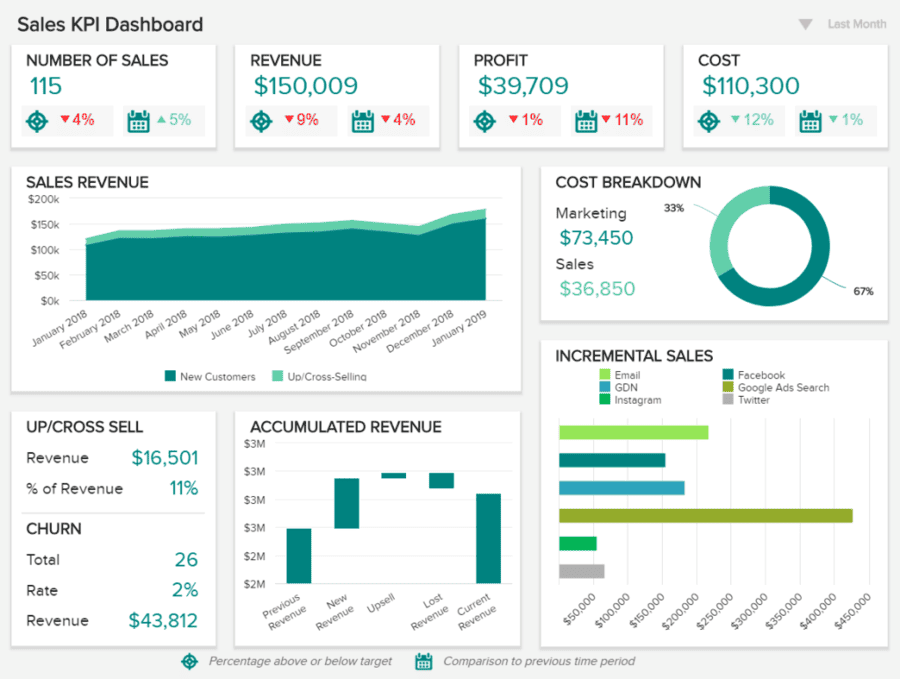
- Dashboard Format – A dashboard presents sales data visually using graphs, line and bar charts, geographic maps, and other visual tools. This format helps to quickly identify sales trends and often relies on business intelligence software.
Here’s an example of a sales report in a dashboard format.
- PDF Format – PDF is a common format when reports have many readers, as it’s easily shared and easy to open and view on most devices.
Here’s an example of a sales report in PDF format.

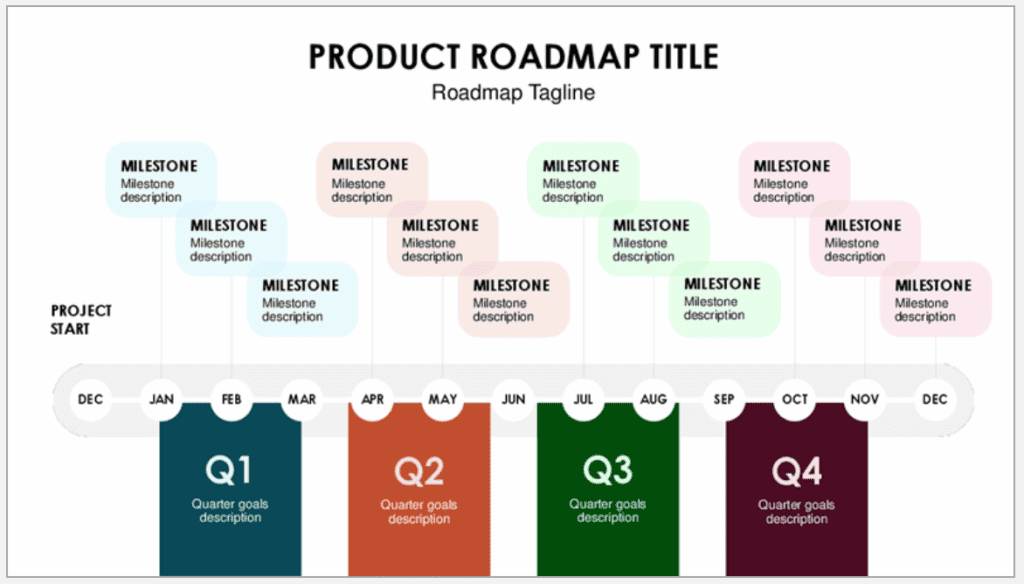
- Presentation Format – Presentations are often used when presenting sales data in a meeting or team call. They are typically created using presentation applications like Microsoft PowerPoint or Apple Keynote.
Here’s an example of a sales report in presentation format.
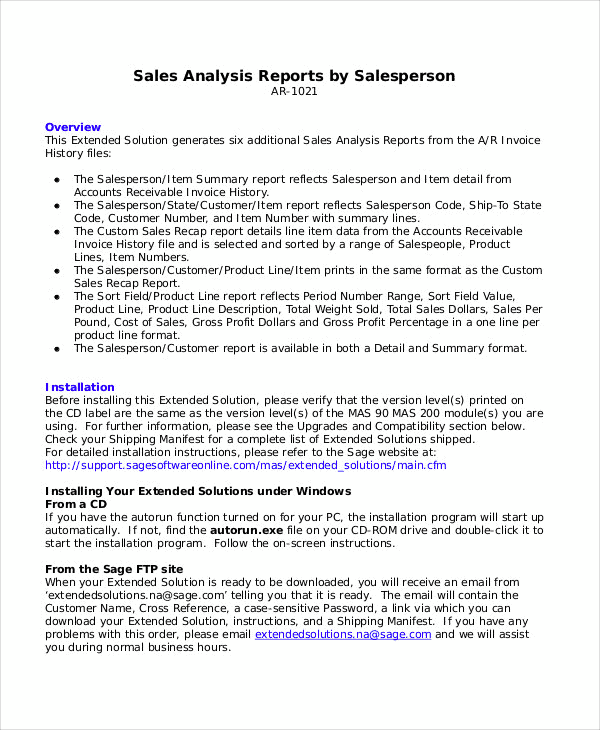
- Narrative Format – A narrative format involves writing a detailed report that describes sales performance in story form. It’s used to add context and allows for much more detail than a spreadsheet or dashboard.
Here’s an example of a sales report in narrative format.
Summary of Sales Report Types
As we discussed before, the type of report and format you choose should take into account the purpose, intended audience, and content of the report. While a formal report may be appropriate for a large corporation with a complex sales structure, a more concise visual report may be more effective for a smaller business.
Your choices should aim to convey the information and insights to ensure they’re understood. Ultimately, what’s most important is that the sales report is clear and concise, and provides actionable guidance that helps improve performance.
What Metrics Should I Include in My Sales Report?
One of the biggest decisions regarding your sales report is which bits of data to include. The question to ask is: which metrics and key performance indicators (KPIs) will provide the most insight?
Your company’s report should be tailored to your company and industry, but all reports should include nine critical metrics.
- Sales Revenue – the total revenue generated from sales within a given period
- Sales Growth – % increase or decrease in sales revenue over a given period
- Sales by Product or Service – Breakdown of sales revenue by product or service
- Sales by Region or Territory – Revenue by geographic region or sales territory
- Average Sales Per Customer – Average amount of revenue generated per customer
- Sales Conversion Rate – % of leads or prospects that make purchases
- Customer Acquisition Cost – Cost of acquiring a new customer, including marketing and sales
- Customer Lifetime Value – Revenue generated from a customer throughout their history with the business
- Sales Pipeline Metrics – Includes metrics related to the sales pipeline, such as the number of leads, sales stages, and sales cycle time
How Do I Generate a Sales Report?
Now that you know the best metrics, it’s time to craft a sales report that includes all of them while illuminating your readers. No problem, right?
If you’re still wondering exactly where to start, here are some tips for writing a stellar sales report.
1. Gather Data From Sales Activities
Start by collecting the metrics and KPIs listed above. You should be able to find this data in your customer relationship management (CRM) software, point-of-sale (POS) systems, e-commerce platforms, and analytics tools. You could also manually track and calculate these metrics with spreadsheets and other tools.
It’s a good idea to check the accuracy and comprehensiveness of the data you gather – there’s nothing worse than an inaccurate sales report.
2. Organize the Data
Now that you’ve got your data, what’s the best way to present it? That depends on which aspects and findings you’d like to highlight. Remember that a good sales report is tailored to the company it describes.
You could present metrics related to prospects first, then those linked to revenue, and finally forecasting. Or you could discuss performance first and leave comparisons and forecasting for the end. It really hinges on what’s important to your business and how you’ll present the data.
Speaking of presentation, it’s generally a good idea to include graphs and images to spruce up your report and grab readers’ attention.
3. Analyze and Infer From the Data
It’s time to look for patterns and trends in the data. Rather than just presenting a data point, determine whether it’s good or bad for the business, why it may have happened, and how it might be repeated in the future, if it’s positive, or avoided, if negative.
Last, but certainly not least, outline how the company might address any trouble areas or risks, and which departments should be involved. Don’t forget your report is a key communication tool between sales and the entire company.
Avoid getting bogged down in jargon and minutiae. Focus on what’s most important to your audience and the company’s future.
4. Revise Your Report
The easier your report is to read, the easier it is to understand. You may be tempted to quickly bang out the report and submit it. But editing and revising is crucial, as the first version is merely a draft and you’re likely to have better ideas as you go through and review.
You’ll also need to proofread the report to make sure you’ve crossed your t’s, dotted your i’s, and all that fun stuff. But once you finish that first draft, it’s a good idea to give your brain a break from the numbers before coming back to the report with fresh eyes and giving it another go.
Also, consider having someone you trust read the report and provide feedback.
5. Write a Conclusion
A sales report conclusion is not like the conclusion of an essay or a more standard business report, which usually just repeats what has come before and ends on a hopeful note.
A well-crafted sales report conclusion should highlight key details and make recommendations that enable company leaders to make informed decisions about the direction of the business.
Here are some steps to follow when creating a sales report conclusion:
- Review Key Findings – Start by reviewing the key findings from your sales report, including any patterns or anomalies you’ve identified. This will help you gain a deeper understanding of the data and identify the insights to highlight in your conclusion.
- Summarize Findings – Summarize the report’s key findings, including any significant changes in sales volume, revenue, or profit. Present them clearly and concisely, using charts, graphs, or tables if helpful.
- Analyze Findings – Examine your key insights and findings to identify the reasons behind any significant changes in sales performance. You might mention changes in market conditions, competitive pressures, or changes in consumer behavior.
You can also use KPIs to measure sales performance against industry standards and previous performance. Use this analysis to determine the underlying drivers of sales and potential areas for improvement.
- Provide Recommendations – Based on your analysis, recommend some steps management could take to improve sales performance. This could include changes in pricing, a better sales script, a new marketing campaign, or different products. Just make sure your recommendations are specific, actionable, and tailored to your business.
- Conclude with a Call to Action – Finally, end your conclusion with a call to action that highlights how sales might improve if the recommendations are implemented. This could include setting specific goals or targets for the next reporting period.
By following these steps, you can create a sales report conclusion that provides real impact and drives improved sales performance.
- Add Appendices and References – It’s often useful to attach relevant documents to the end of your report. This ensures you’re not slowing down readers with technicalities in the body of the report, while also providing them with all the relevant info and calculations when they need it.
Examples of appendices include:
- Sales data tables
- Sales charts and graphs
- Customer survey results
- Sales projections
- Contracts
- Invoices
- Financial records
Examples of references include:
- Sales data sources
- Industry benchmarks
- Sales goals or targets
- Sales team performance
- Customer feedback
- Write an Executive Summary – The executive summary is an essential part of your sales report. As the name suggests, it’s written so your company’s executives are easily able to digest and understand the main insights without reading the entire report.
A good executive summary enables management to quickly see the key takeaways. These are often best presented in bullet points, following a brief introduction that highlights the purpose and scope of the report and key assumptions or limitations.
Here are the steps to create an executive summary for your sales report:
- Start with an Introduction
- Highlight Key Insights and Recommendations
- Summarize the Report and Look Forward
A skillfully-written executive summary helps busy executives make informed decisions without reading the entire report, while a poorly-written one could lead to regretful management choices.
Although both the conclusion and executive summary summarize key points and findings, the executive summary is a separate document typically placed at the start of the report. Take the time to do this section well, as it underscores all the hard work you put into the report.
Conclusion
A well-written sales report is more than a snapshot of your sales process and performance. It aims to provide valuable insights that drive decision-making and business growth. Few regularly created documents are more important to the success of your business.
Keep this in mind as you determine which type of report, format, and metrics best suit your business, and your sales report could help management implement strategies that keep your company ahead of the competition for years to come.
FAQs
What are some common pitfalls when writing a sales report?
Common pitfalls to avoid when writing a sales report include lack of clarity, focus, or actionability; too much data, ignoring context, poor formatting, and overemphasis on numbers. Use clear headings, bullet points, and charts to present your data in a logical and easy-to-follow manner. Don’t forget to tell a story with your data. Use anecdotes or case studies to illustrate your points and provide context for your sales figures.
What should I do if I identify areas of concern in my sales report?
If you identify areas of concern in your sales report, develop action plans to address the issues or opportunities for growth. This may involve creating new goals and making changes to sales strategies, marketing efforts, or product offerings. Be sure to measure the success of these actions over time.
How often do I create a sales report?
The frequency of your sales report depends on the needs and objectives of your business. Generally, monthly or quarterly reports are common, but some organizations prefer weekly or daily reports.
A daily sales report provides a detailed snapshot of sales activities and performance daily, while a weekly sales report offers a more comprehensive overview of sales trends over a longer period.
A monthly sales report is useful for tracking long-term sales goals and identifying areas for improvement, while a quarterly or annual sales report is often used for assessing overall business performance and making strategic decisions.
Are there tools that can help create my sales report?
There are many tools available for creating a sales report, including Microsoft Excel and Google Sheets. Online websites and CRM tools such as Databox, HubSpot, and Zoho CRM also provide templates and example reports you can follow, and can even generate parts of the report for you. Good luck!